|
Setup
Your Team & League Parameters:

There are 2 major
types of Fantasy Leagues in existence today, One is based on a Fantasy
Points System and the other is called Rotisserie. Head to Head leagues
use a variation of either the Fantasy Points System or Rotisserie
setup. If you play in a Head to Head league, see which of your scoring
categories fits best with either our Fantasy Points or Rotisserie
system. The main difference with Head to Head leagues is that the
scoring period ends and starts anew every week, rather than once a
year.
Fantasy
Fantasy Points System
� This is a league where your player stats are
given distinct point values that are accumulated either throughout the year
or on possibly a week to week basis (ie. Head to Head leagues.) The fantasy team with the most cumulative points wins
at the end of the defined period.
Roto
Rotisserie
Points System - This is a league where your player stats are combined
according to category and compared verses other team owners and point
values are given according to a ranking system. The only real
difference to you as team owner is to understand that in most
Rotisserie type leagues, each point category is equally weighed. In
other words a homerun category may be worth the same as the stolen
base category. In the Fantasy Point System, each category has a
different value & weight. If your not sure which projections model
to use, ask your commissioner.
Head to Head Variant?-
Head
to Head is treated exactly the same way as a Year Total Rotisserie or
Fantasy points system prior to a preseason draft. The difference
between Head to Head and YTD scoring, is one league registers each
win/loss on a weekly basis and the other uses a year
cumulative. However the scoring inputs (Fantasy Points or Roto)
remain the same in most cases.
Most H2H leagues use a Rotisserie setup
(see above),
just
enter a 1 next to each categories in the Rotisserie scoring type. If
you get an assigned point value for each category then select the
Fantasy Points setup and assign the proper points to each scoring
category.
Although we cover a great deal of categories some
of the categories are not prognosticated and thus not an option in the
software. Do consider that some categories although a scoring criteria
in your league, have
little effect on the value of a player. Categories such as No-hitters
or Perfect Games are very difficult to project, but your front runners are likely the
top pitchers in the league.
Important:
for the Setup changes to take effect you must click on the FINISH button
before running/viewing the projections or the cheatsheets.
League Setup
Edit League Settings
--->Select
league Type: Fantasy
Points setup or Rotisserie (see above for definition)
---># Teams
in League: If you play
in a private league, enter the
number of teams (General Managers) that will be participating in your draft. If
you play in a national contest, set this value to 12.
--->Players
to Include:
Select the leagues that your are allowed to draft players from: NL, AL
or both NL/AL.
--->Positions (Batters & Pitchers)
Most leagues
require you to draft a minimum/maximum amount of players by position, the
software will accommodate this. Enter the number of players that your
league requires you to start at each position, wildcard positions such as
Utility, Corner, and Middle Infield. If your league does not specify
positions, the Utility input box will accommodate this
setup.
If
your league
does not specify whether Pitchers are Starters or Relievers. We
generally suggest a 2 to 1 ratio (2 starters for every 1 reliever).
There is an option for Utility Pitcher, where you can designate all
the pitchers into one slot, however we do not recommend it. As the
Mock Draft program exemplifies, you may fall short in the Saves
category, which is not an optimal solution.
Your bench players are entered in as
reserves.
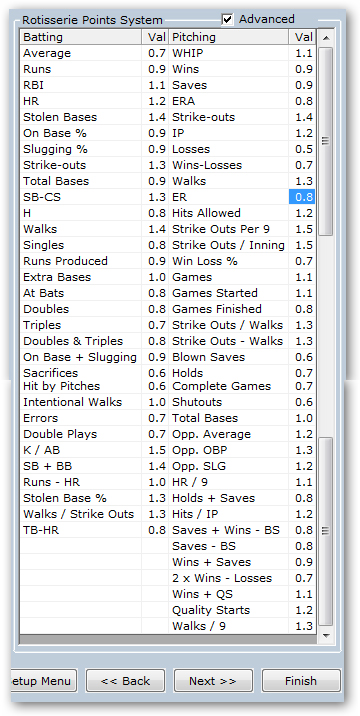
--->Select
League Scoring Categories
Depending on the type of league you
selected (Fantasy Points or Rotisserie), you now have the opportunity
to select the scoring categories that match your league. This is an
important step as the closer we can replicate your league scoring the
more accurate the player valuations and rankings will be.
If Fantasy Points is selected, you can
enter in the valuation (number) attributed to each scoring category.
As an example if your league awards 6 point per homerun, you would
enter a 6 in the column next to homerun. If Rotisserie is
selected, you can select the scoring categories using the check boxes.
For additional variations to the Rotisserie scoring categories, see
the Advanced scoring options listed below
If you play in a Roto league
and would like to give different weights to each Roto category that
you select, you can. Entering in a weight such as .5, discounts the
category by 50%. This option will allow you to weigh each
Rotisserie
category according to your preference.
Although most leagues use an equal
weighing for each Rotisserie category some leagues do not. Even if
your league uses an equal weighing system, it's important to
understand that not every statistical category has an equal
predictability.
From a
predictability standpoint here is the typical correlation in
forecasting each of the following player stat categories :
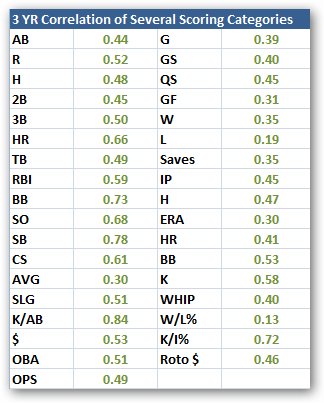
1.00
is considered a perfect "fit", the better the fit the more reliable
the forecast. Based on this information we know that there is
more predictability in forecasting Homeruns, RBI, Stolen Bases, and
Pitcher Strikeouts. Categories that offer poor predictability year
over year include Batting Average, ERA, WHIP, and Saves. It's not a
surprise to learn that most of the pitching categories offer little
predictability.
For
those who like to play the percentages, we suggest the
following weighing within these typical categories.
Important: This
option can also be used in FANTASY POINTS LEAGUES. If you play in a points
based league, select Fantasy Points instead of Rotisserie and multiply
the scoring categories by the listing that you see above. If for
instance you league scores 2 points for every hit and we assign a
factor of .9 to hits, then you can enter 1.8 in the fantasy scoring
area for Hits.
Important:
for the Setup changes to take effect you must click on the
Finish button
before running/viewing the projections or the cheatsheets.
League Team Names and Budgets
--->Identify
the team names in your league, specify budgets, and identify your
team.
Identifying your team (checkbox) is very important as
it allows the system to keep track of your team during your
draft or when using the Mock Draft option. You can edit the team
name by double clicking on the name of the team. From here you can
also Add or remove a team by using the visible button name.
Auction and Other (Advanced) Settings
--->Minimum Bid
Value: If you play in an auction league, enter the Minimum
bid amount in this area.
--->Auction
Style Drafting (Dollars Allowed): If you play in a league that uses an auction system or assigns Dollar
Values to players, enter that amount in this field
(numerical values only, NO commas or $ signs necessary). This field
has a limitation of 99999 (If your league uses a higher number its all
relative anyway, for instance if your salary cap is $2,600,000, you
can leave off the last 3 digits (2600) and your cheatsheet will be
valued in thousands instead.) If you are not sure how many dollars are
allowed or if you straight draft (draft based on order not auction
Dollars) you can uncheck the Auction Style Drafting box. If your
league allows owners to start with a different $ value (some keeper
leagues), you can specify the individual team budget using the Fantasy
Teams and Budget link located in the Setup Menu.
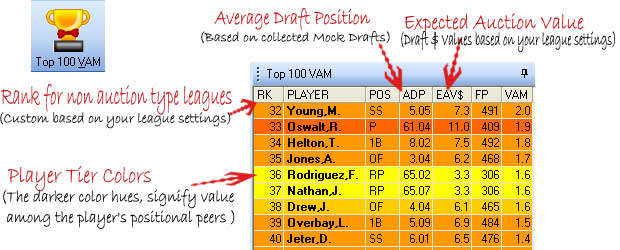
--->Expected
Auction Value (EAV) is an
algorithm developed to mimic the non linear decline in auction prices
during the span of a draft. Its primary function is to aid those
who participate in an auction draft.
Most auction drafts follow a Typical pattern.
For more on EAV,
click here
--->Splits:
Again for auction leagues, some
fantasy GMs like to specify the amount they believe the league will
spend on Hitting verses pitching. The result of this split will shift
the EAV$ for each player. For the typical league a 65/35
hitting/pitching split is considered standard.
--->Draft
Options:
Draft Style
lets the program know what type of league you participate in.
Fantasy
Fantasy Points System
� This is a league where your player stats are
given distinct point values that are accumulated either throughout the year
or on possibly a week to week basis (ie. Head to Head leagues.) The fantasy team with the most cumulative points wins
at the end of the defined period. Additionally
you have an option, if you select the Fantasy Points System, to see
Fantasy Points on your cheatsheet instead of Values (from the Setup
Menu, select other Settings. From there you will see Cheatsheet
Display Options under Reporting Options)
Roto
Rotisserie
Points System - This is a league where your player stats are combined
according to category and compared verses other team owners and point
values are given according to a ranking system. The default weight for
each category is 1. As team owner it's important to understand
that in most Rotisserie type leagues, each point category is equally
weighed. In other words a homerun category may be worth the same as
the stolen base category. In the Fantasy Point System, each category
has a different value & weight.
Head to Head Variant?-
Head
to Head is treated exactly the same way as a Year Total Rotisserie or
Fantasy points system prior to a preseason draft. The difference
between Head to Head and YTD scoring, is one league registers each
win/loss on a weekly basis and the other uses a year
cumulative. However the scoring inputs (Fantasy Points or Roto)
remain the same in most cases.
Most H2H leagues use a Rotisserie setup
(see above),
just
enter a 1 next to each categories in the Rotisserie scoring type. If
you get an assigned point value for each category then select the
Fantasy Points setup and assign the proper points to each scoring
category.
Display Option:
--->Display
Options::
lets you choose whether you would like to see the players crossed off
or removed from the projection pages as they are selected in the draft
or mock draft mode.
--->Cheatsheet
Display:
Specify what you would like to see
on your Cheat Sheet (ie. Fantasy Points / EAV$ ) ADP
allows you to see where the fantasy community consensus ranks the
players. 8.12 represents the 8th round, 12th pick, according to the
number of teams in your league.
--->Rank
Based On:
Specify what you would like to see
on your Cheat Sheet rankings based on. Fantasy Points / EAV$
/ ADP - Fantasy Points and EAV is vbased on our
projections customized to your league settings. ADP is not our ranking
(fantasy community consensus), therefore should not be used at your
draft.
--->Position
Eligibility
Enter your league criteria based on
games played the previous year. Your answer here will determine
where players appear in the projections area. Players can now be
viewed on multiple position screens based on your criteria. If you
would only like to see the players listed at only 1 position rather
than multiple positions on the projections pages, you can enter in 163
here.
MLB Teams
to Exclude
--->
If you play in a league where certain MLB
teams are excluded (outside of the typical NL or AL formations). You
can check off the teams that do not apply to your draft.
Program Settings
--->Option
to see popup window for auction leagues to enter cost
--->Option to see Tier Colored cheatsheets
Creating
Multiple Teams for different Leagues:
New Team
(Located on the
Menu Bar File | New League
)
Enter your new team name and setup your league
parameters to your needs.
Switch Team
(Located on the
Menu Bar File | Switch League
)
Viewing
and Understanding the Fantistics Projections
 Projections (Located
on the Menu Bar Player | Projections) Projections (Located
on the Menu Bar Player | Projections)
Here is where you will
find the Fantistics Baseball Player Projections (registered
users only) for the upcoming season. You will notice that the players
listed are a result of the league parameters you chose in Setup (see
Setup),
in other words if you choose NL only, just the NL players will appear.
The projections are sorted in Player Name order and can be sorted as
per your desire (see Sorting). The Batter and
Pitcher Projections are located in separate "sheets",
viewable by clicking (left mouse button) on either tab located in the
top left corner of the screen. These projections
are updated throughout the preseason for registered users, so be sure
to check for web updates on a frequent basis (see Web
Update). Below is the Legend Key for abbreviations that appear on
the top line of the projections screen.
|
* |
Legend Key for Batters |
* |
Legend Key for Pitchers |
|
Lg |
League |
Lg |
League |
|
Pos |
Fielding
Position |
Pos |
Fielding
Position |
|
TM |
Team |
TM |
Team |
|
G |
Games
Played |
G |
Games
Played |
|
AB |
At
bats |
GS |
Games
Started |
|
R |
Runs
scored |
QS |
Quality
Starts |
|
H |
Total
hits |
GF |
Games
Finished |
|
2B |
Doubles |
W |
Wins |
|
3B |
Triples |
L |
Losses |
|
HR |
Homeruns |
S |
Saves |
|
TB |
Total
bases |
INN |
Innings
pitched |
|
RBI |
Runs
Batted In |
H |
Hits
allowed |
|
BB |
Walks |
ERA |
Earned
Run Average |
|
SO |
Strike
outs |
HR |
Homeruns
allowed |
|
SB |
Stolen
Bases |
BB |
Walks
allowed |
|
CS |
Caught
Stealing |
K |
Strikeouts |
|
AVG |
Batting
Average |
WHIP |
Walks
+ Hits divided by Innings Pitched |
|
Slug |
Slugging
Percentage |
W/L% |
Wins
divided by Losses |
|
K/AB |
Strikeouts/
At Bats |
K/I% |
Strikeouts
divided by Innings Pitched |
|
HBP |
Hit By Pitch |
BS |
Blown Saves |
|
IBB |
Intentional Walks |
HD |
Holds |
|
ERR |
Errors |
CG |
Complete Games |
|
DP |
Double Plays |
SH |
Shutouts |
|
SAC |
Sacrifices |
BFP |
Batters Faced |
|
FP |
Fantasy Points |
FP |
Fantasy
Points |
|
FPI |
Fantasy Production Indicator |
FPI |
Fantasy Production Indicator |
|
VAM |
Value
Above Mean |
VAM |
Value
Above Mean |
|
OBP |
On Base Percentage |
QS% |
Quality Start Percentage |
|
OPS |
OBP + Slugging Percentage |
OAVG |
Opposition Average Allowed |
|
EYE |
Walks / Strikeouts |
OOBP |
Opposition On Base % Allowed |
|
EAV$ |
Expected Auction Value (For Auction
Drafts) |
EAV$ |
Expected Auction Value
(For
Auction Drafts) |
|
$ |
Theoretical/Linear Value |
$ |
Theoretical/Linear Value |
|
DC |
Daily Consistency - How many days in
2010 the player
produced better than average fantasy results. The max possible is
162. |
|
|
|
WC |
Weekly Consistency - How many weeks in
2010 the
player produced better than average fantasy results. The max
possible is 26. |
|
|
|
TFC |
Online contest Player salaries |
TFC |
Online contest Player salaries |
|
ADP |
Average Draft Position |
ADP |
Average Draft Position |
|
Notes |
Fantistics Player Notes |
Notes |
Fantistics Player Notes |
Selecting the
Projections Columns that you want to view
From the projections area, right mouse
click on the column header. To sort left mouse click.
Sorting
the Fantistics Projections
Sorting
Selecting one of the column headers located on the top on the projections
page. You will see more options appear if your league
participates in both leagues.
You can sort the players by any of
the stat columns, including VAM, by clicking on the column
heading. Remember that we recommend VAM during the first 80-100 players
selected, then sort by EAV$.
Understanding the Intelligence Data in the top section of the
Projections Page
Position Eligibility: The upper right
hand corner of the projections screen displays the positions played by
each player during the 2010 season. This information can be critical
in spotting players that may become move valuable at other positions.
Check your league rules (remember you can change the any player
position, and the software will calculate a new VAM ranking)
Historical Stats: Many of
the indicators listed up top on the Projections Page, are some of the
most widely recognized stats used by Fantasy Baseball enthusiasts. The
stats represent a look back at each players 3 year history and the
outlook for 2012. Included stats for Batters include AB, AVG, HR,R, SB,
and RBI. Similarly for pitchers,
IP, WHIP, ERA, W, and Saves.
Using
The Cheatsheets (Draft Ranking Lists)
 CheatSheets CheatSheets
The Cheatsheets or Draft Rankings
lists are the pages that many of you will be using on your drafting
day. The player names are organized by their primary expected position
for the upcoming season. (The exception to this rule
are the Designated Hitters who are positioned according to their
natural playing positions, the
reason we did not breakout the Designated hitters into there own
category is because many leagues do not use the DH category.)
To the left of the players
name is a ranking by position, to the immediate right is his current
team followed by the computed value according to your setup
parameters. The Value, does not indicate the auction value in a live
draft, it is just an indication tool based on Value and your league
parameters (more on this in the Projections Section below).
The last column of the
cheatsheet is a ranking according to our recommended draft strategy
VAM, (click here for more on VAM).
Lastly you will notice that
some players are Zeroed out the cheatsheet, this does not mean that
they will not produce any value, it just means that they will not
likely be drafted based on your league parameters that you have setup
(if you have a limited number of roster spots the players above these
guys will get drafted first, making it unlikely that they will be
drafted).
Printing
The Cheatsheets
 Printing Printing
Printing the Cheatsheets is simple
All that is necessary is for you to have the cheatsheets window
active, and then from the Menu File|Print.
Exporting
The Projections to Excel
Not yet available for Mac
product.
Selecting "Keeper players"
or players not included
in your Draft
Not
yet available for Mac product, right now you can select players to
teams by mouse clicking on a player name and selecting him to a team.
Updating
your
Fantistics Preseason Projections (Must
be online)
 Web Update Web Update
Our
goal is to not only provide you with the best projections but also
provide you with the most up to date fantasy projections found
anywhere. As we get closer to the season you will find that the
fantasy projections are updated on a daily basis. Early projections
may change considerably for younger players as their playing time may
be dependant on the events of spring training. We recommend that you use
our web update feature before your draft (if you are not a registered
user and would like to become eligible for the updated projections,
click
here.)
Open up the Web Update popup window
and enter your Fantistics Baseball ID and password. Click on the "Download"
button (you must be connected to the internet), if a new version of
the projections database exists, it will begin to download.
Important:
You must
enter your ID and Password that was assigned by you when you purchased
the Fantistics Baseball package, this is the only way to receive the
latest version of the projections. If you forgot/lost your ID &
password, click
here to enter your email into our automated password system, it
will be sent to you via email (you must be connected to the
internet to use this option).
 Mock
Draft Module
Practice
your drafting Skills Mock
Draft Module
Practice
your drafting Skills
Get
your Mock on...this module is undoubtedly the most addicting fantasy tools we've
ever created! Fantasy GMs can simulate their
fantasy draft before draft day using their specific scoring rules.
More importantly you'll be able select players at your own pace,
instantly seeing the scoring ramifications of the decisions you make,
test the Fantistics Draft Strategy (VAM) and valuations (EAV$), while
honing your drafting skills....and you won't have to spend 3 hours
doing it (pause your draft at any time or just walk away).
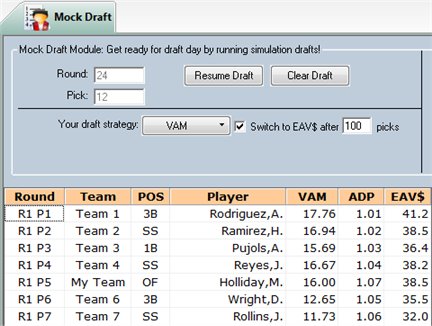
Serpentine Mock Draft Simulation
The
Mock Draft module within the Fantistics Player Projections
program, allows fantasy GMs to practice drafting skills
using our recommended VAM draft strategy. The
opponents' (automated computer selectors) will be using ADP.
ADP or Average Draft Position represents an accumulation of
fantasy drafts throughout the fantasy baseball
community. We collect this information every week during spring
training and update ADP accordingly. The Mock Draft module also allows
us to use the "true" VAM draft strategy, were we
recommend switching to player valuation (EAV$)
after the first 90-100 selections of your draft. With this mock draft
feature you are free to decide when you would like to switch from the
VAM strategy or not switch (if you choose.)
Other
draft strategy options you can select as your strategy include EAV$,
Fantasy Points (if fantasy points is selected in Setup area) or
ADP (In most cases you will experience that our VAM
strategy produces the most optimal results.)
Options include 1. Drafting starting positions before reserves
(recommended), 2. Having the program stop before your selection
(allowing you to make selections, instead of the selected automated
strategy), and 3. Recalculating Values to capture the draft "position
scarcity" (see footnote below).
We
recommend that you open the Rosters tab and the Draft Summary tab,
prior to running your mock draft. Having these windows open will allow
you to toggle between the screens, allowing you to see how your team
is shaping up verses your opponents, and more importantly: how your
team is accumulating fantasy points or Roto points verses the
competition (see Draft Summary).
Footnote on Draft Position Scarcity:
There are two types of Position Scarcity. One is Short Term and
the other is Long Term. The long term position scarcity, which
we capture in our VAM calculation takes into account the scarcity of
players prior to your draft. Every league has it's own positional
scarcities. As an example one league might require 3 outfielders that
are part of a starting roster, while others may have 5, one may have 8
owners, while another 14...this creates positional scarcity, see our
VAM article for more. Again, we custom capture this
scarcity based on your league settings using our VAM model. The other
scarcity occurs DURING your draft. As players are selected, these
selected positions become scarce (even if it's a short term
situation.) In other words if you suddenly have a "run" on Shortstops,
the level of quality remaining at that position becomes scarce, thus
there is an artificial inflation placed on the remaining players that
are above the mean. Here in lies the dilemma. If a certain position is
neglected (or not drafted), such as pitchers who are no longer being
drafted in the first rounds of many typical 5x5 drafts, then they have
a false devaluation as other position players will continue to climb
above them until they (pitchers) begin to be selected. I say false
valuation, since there are a finite number of players in your fantasy
universe, and at the end of the draft...players that were neglected
early on due to DRAFT SCARCITY regain their pre-draft valuation.
Because of this, I recommend that the "Recalculate Values after each
draft selection" check box not be selected until a few rounds have
passed (pause your draft, and select). This delayed recalculation will
allow for a truer valuation as the early "neglected" positions will
"be in play" reducing their false devaluation. I recommend this action
in both MOCK DRAFTS and ACTUAL DRAFTS. Although this method produces
only slightly better results, that could be the difference between 1st
and 2nd place.
Auction Mock Draft Simulation:
Although VAM is the
definitive draft methodology recommended for Serpentine/non auction
drafts, Auction drafts are heavily influenced by the difference
between the actual auction price and the expected auction value.
Obviously, there is no way to capture this through a simulation.
However, budget allocation strategies can be simulated.� VAM Budget�
allows you to test different spending methods for your team while
adhering to the league budget. If for example you would like to avoid
a high/low spending strategy, you can set the simulation to draft the
25th listed player according to VAM for the first 80 or so
players. This will allow your team to take a more balanced approach.
Average Draft Position (ADP) - Starting this
season, we are updating the projections software throughout the
preseason with a new indicator called Average Draft Position (ADP).
ADP will represent an accumulation of drafts throughout the fantasy
baseball community. The average draft slot where the MLB players are
selected will then be converted to your specific league setting. Thus
if your league for instance has 8 teams, the MLB player drafted 9th nationally
would appear as 2.01 in your software (2.01 represents 1st slot of the
second round).
Disadvantaged fantasy baseball GMs use generic cheatsheets, it's an advantage to
not only have rankings that are tailored to your league, but also to know the sentiment of the general
fantasy community. Using this new tool you'll be able to ascertain the
possible mindset of those around you. One possible use of ADP is
delaying the drafting of a player who we hold in higher esteem until a
later round.
Analytics Draft Day Strategy
 Value Above
Mean (also known as Value Based Drafting) is the
position scarcity theory that we first published in 1999. It is
primarily used during an straight
draft (non auction.) Although there is
usefulness in knowing the relative strength of each player's position
regardless of draft style. For your non auction draft, we recommend
that you highly consider our VAM ranking on the right side of the
projections software. We derived the strategy in the early
1990's and we have both successful empirical research as well as over
9 years of success in recommending it to our loyal subscriber base. Value Above
Mean (also known as Value Based Drafting) is the
position scarcity theory that we first published in 1999. It is
primarily used during an straight
draft (non auction.) Although there is
usefulness in knowing the relative strength of each player's position
regardless of draft style. For your non auction draft, we recommend
that you highly consider our VAM ranking on the right side of the
projections software. We derived the strategy in the early
1990's and we have both successful empirical research as well as over
9 years of success in recommending it to our loyal subscriber base.
To most easily describe VAM: In a
nutshell, each position that we have to fill on our fantasy roster
does not have an equal valuation. Some positions in the MLB universe
contain an overwhelming majority of weak hitting players (catchers for
instance), while other positions contain an overwhelming majority of
solid offensive players (First Baseman). None the less we must fill in
this void with an eligible position player. Since the goal is to
maximize the production from each position on our roster, we want to
fill our rosters with the best player available at the time of our
draft selection. One of the ways and we believe the best way to
do this is to quantify the value of each player verses the replacement
level at his said position.
Their are 2 components that we use to
quantify this:
1. What is the mean (average) value of
the players at each of these required positions. This is based on
the number of starters required in your league. Where does each player
within that position measure compared to this benchmark.
and
2. What is the predictability of each
position. Some positions are easier to predict based on the
demands of the said position. As an example, due to the wear and
tear factor relating to catchers, they often are a risk to even
equal the 405 ABs that they average as a group (20% less than what
other positions average). Based on our forecasting history we place a
discount or premium to certain positions, namely Pitchers and Catchers
at a discount and outfielders and First baseman at a premium.
So there is a dichotomy at play here. Many
of the positions that are abundant in talent also have a high
predictability in forecasting success. Thus there is a reason why Top
Tier catchers and pitchers are rarely among the top 10 draft
selections. None the less, there is a way to quantify the advantages
and if you believe in the laws of probability then you understand the
advantage of playing the percentages when it's spread over your entire
roster.
|
3 YR Average Predictability
|
|
(based soley on Prior Year Stats) |
| |
Following Season Performance within |
|
Position |
15% |
25% |
35% |
|
C |
32% |
43% |
53% |
|
1B |
62% |
75% |
87% |
|
2B |
33% |
52% |
65% |
|
SS |
40% |
55% |
68% |
|
3B |
38% |
53% |
67% |
|
OF |
49% |
63% |
75% |
|
Starting P |
30% |
41% |
47% |
|
Relief P |
37% |
48% |
55% |
VAM can be found on the right side of the
Top 100 VAM listing and the right hand side of the cheatsheets. If you
use the software during your draft, VAM can recalculate based on the
new position scarcity developing live during your draft.
 Expected
Auction Value (EAV)
is an
algorithm developed to mimic the non linear decline in auction prices
during the span of a fantasy draft. Its primary function is to aid those
who participate in an auction draft. Expected
Auction Value (EAV)
is an
algorithm developed to mimic the non linear decline in auction prices
during the span of a fantasy draft. Its primary function is to aid those
who participate in an auction draft.
As long time fantistics subscribers
already know, our "$ values" have and still do represent the value of that players
potential return to your fantasy team at the end of the playing
season. In the past, we made a concerted effort to make sure that our
subscribers understand that each and every auction has a unique
outcome and the prices paid are subject to the same forces that
permeate any live auction, supply and demand.
For the first time, we are presenting a
calculation based on your league settings where we attempt to mimic
what the auction bidding will be like during your draft. Since the
natural laws of supply and demand are still unpredictable to an extent, the values presented
in EAV will represent an approximation based on the
typical bidding pattern of most Fantasy Baseball Drafts. EAV or
Expected Auction Value is based on our study which analyzed the results
of 600+ completed auction drafts. Our auction
draft data collection includes results from national contest drafts,
private drafts, and public drafts. Private League drafts included
leagues that ranged from 6-24 GMs and scoring setups that were based
on Fantasy Point, Rotisserie, and Head to Head leagues. In the
end, we found that most drafts fell into one of three patterns.
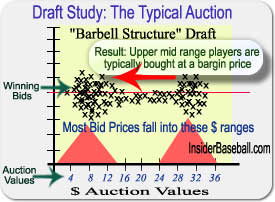
The Typical Bidding Draft -
In this type of bidding environment, most of the top players are sold
at reasonable or full projection valuation, which leads to the typical
amount of bargains in the middle and late stages of the draft. This
type of bidding is most typical in private leagues that are managed by
seasoned GMs.
The Conservative Bidding Draft - In this type of bidding environment,
most of the top players are sold at a discount, as a good number of
GM's are looking for bargains. This typically leads to the
bargains in early portion of the draft as top players (top 5%) are
selling at a discount greater than 10-15%. This leads to higher than
expected winning bids on the mid to late round players.
The Aggressive Bidding Draft -
In this type of bidding environment,
most of the top players are sold at a premium as an assertive majority of
GM's are infatuated with the top players. This typically leads to
bargains in the latter portion of the draft as early mid quality players
are selling at a discount greater than expected. This also leads to lower
than expected winning bids on the mid and late round players due
to the money drain on the top players.
What type of auction will you be
in this year? If you have a history with the same GMs, what has your
auction been like in the past? If you have last year's auction draft
info, then it's a good idea to look back and see how your league typically bids.
The good news is that none of the three EAV options will be
dramatically different (only a 10-15% difference for a mid tier player.)
Using this tool, you should be able to conceptually find bargains based on the computed fantasy $ valuation, the
Expected Auction Value and the current bidding level.
To illustrate our concept, below is screenshot from the projections software showing the Linear Player Valuation and the
Expected Auction Value calculation side by side:
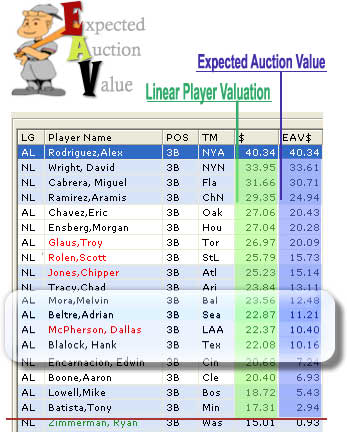 |
Depending on your
league setup, some players offer additional value based on the
uneven distribution of auction $ spent
during a typical draft. |
|
Middle tier
players are often discounted in an un-linear distribution (unevenly) during a live auction, EAV
attempts to estimate what this value will be for each player. Using EAV with the
Linear Player Valuation ( $ ), you can spot the players that offer
value in the later phase of your draft and what you can expect to
pay for them. |
In the example above we are using a $260 auction budget. A player like
Eric Chavez is valued at $27.06 based on his year end contribution
(projection) to your fantasy team, while a player like Adrian Beltre
is valued at 22.87 (approximately a $4 difference). Yet, due to his
placement among other players, Beltre will likely fall further
into a discount area (as there is a premium paid for upper tier
players, leaving less money for lesser tier players). Thus, while a
player like Chavez is discounted at 24% based on his proximity to the
upper tier players, Beltre or a player in his class is discounted at
50+%. The net gain in capturing Beltre at ~$11 would be ~$5
(-27.06+22.87+20.43-11.21). And who could not use an extra $5 on draft
day?
More thoughts and suggestions:
Mid tier players typically sell for more than
expected when nominated early during a draft. Resist the urge. As an example: Someone nominates a
player like Mike Piazza very early in the draft. You look at his
projected year end $ value on our software (lets say $14), his
Expected Auction Value shows $8, he's currently auctioning at $13.
Obviously he's trading for a premium, which will mean that other
players in his neighborhood (offensively) could be had at a possible
discount at some point in the draft. Unless you have a strong
conviction, it's probably wise to let him go.
Top tier players typically sell for a discount
during the middle to late stages of a draft, which is sometimes a great situation
for those who have excess funds. As an example: Todd Helton is not
nominated until the back end of your draft. You look at his
projected year end $ value on our software (lets say $29), his
Expected Auction Value shows $26, bidding is ending at $20.
Obviously he's trading for a discount, if you're in need of a quality
1B and have the excess funds; you have yourself a draft day steal.
Bottom tier players sell at a great discount
when top and mid range players are sold above their expected
levels.
This aggressiveness early in the draft will drive down prices in the
back end, making for great deals. However it's highly improbable to win a
fantasy championship with a team full of bottom tier players, no
matter what the level of value.
One of my draft day strategies prior to draft day is to
conduct a mock draft, selecting the type of players that will fill my
roster with "the best fit" (Maximize output with the best allocation
of dollars...the goal of every Fantasy GM and MLB GM). Of importance is not
necessarily the players, but the type of players that should be
selected to produce the best outcome for my team. If you do mock draft
using the software, our Draft Summary section will account for
both the dollars spent and the accumulation of stats. Using these
stats we'll be able to tell you the total Fantasy Point expectation
for your team if you play in a Fantasy Points League as well as the
Rotisserie ranking expectation of your
team for each of the scoring categories.
Important: You can change your
EAV calculation during your draft. All you need to do is visit the
setup page and reset the sliding bar and save.
Player Search, Player Lists, & Projections Filter

Search
Player
Use the Player search to quickly locate
players, either in your draft preparation or on draft day. Double
Click on the player name to see his profile.
Draft Section: Rosters
 Selecting Players to be placed on Rosters Selecting Players to be placed on Rosters
- Select players by
right clicking on the any of the
player names viewable from the Projections, Top 100 VAM,
or the Search folders.
-
Choose the team that has drafted the
player (via the popup box).
-
Select the position that you would like
that player to be placed on (an apostrophe will appear next to the
players expected playing position)
- There
is the option to enter in a dollar price for those who participate
in an auction league (If this box does not appear after selecting
the player position, then from the Settings
menu
select Program Settings and check the box to
see the cost popup)
As players are selected their names as well as their
statistics will be crossed out or disappear.
The Rosters Section
League Draft Roster (Grid of Fantasy Teams - Middle of
page)- To select a player to the rosters grid in one of the
following manners:
1. From any of the following pages
you can right click a player to a team (Projections, Top 100 VAM, or
Search) If a pop up box does not appear double click on the selected
player and at that point you will have the option of selecting to see
that pop up every time you select a player (Settings Area)
Change or enter a team name
(From the Settings|Teams Section)
You can move a player back to
the list of available players by right clicking and undrafting him using your
mouse.
Move a player to another Team,
by right mouse clicking and selecting Move To.
**TIP: If you are
using the draft program during your draft, it is highly recommended
that you also have the SEARCH window open, to easily find players as
they are being drafted.
Draft Totals (bottom of the rosters page)- The draft totals at
the bottom of the page will give you the quick stats that you'll need
to make decisions with.
Budget: How much money each
owner starts with. If you have keeper players, then as you enter the
players into the roster, be sure to assign a $ value so the owners
Budget is reflective.
Spent Hitting: Amount spent on
hitting with % spent of total budget in brackets ()
Spent Pitching:
Amount spent on pitching with % spent of
total budget in brackets ()
Remaining: Available Dollars
remaining
Relative Value: The relative
value of the players you selected, remember the listed projection
values and what you actually pay will differ especially in the middle
and late rounds. For a better understanding of relative value and what
the projection values represent, please
click here.
Net Gain: The Relative Value - Cost
#Drafted:
The number of players selected, in brackets are the reserves.
#Needed:
The number of players needed, in
brackets are the reserves.
Draft Summary

Top Section: Detailed Draft Totals also showing
the accumulated stat totals for each of your leagues scoring
categories.
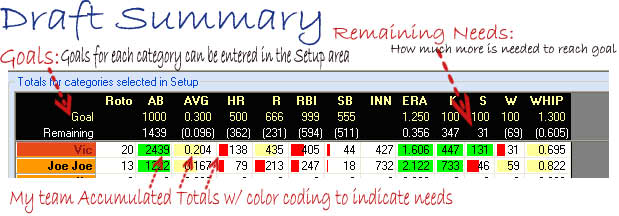
Bottom Section:
Ranking Total for each stat category, for those who play in a
Rotisserie type format, the higher values are most beneficial.
The Columns that will appear in the
scoring categories are the same that were selected in your setup area,
along with AB (at bats) for batters and IP (Innings Pitched) for
pitchers.
The
Fantistics Projections
(Written
by Fantistics Statistician Anthony A. Perri)
History repeats itself;
whether it�s relating to the prepayment habits of an interest
rate sensitive consumer, the behavioral aspects of the stock
market, or individual baseball player statistics
�history repeats itself!
Here�s the
concept to understand: Why does history repeat itself?
If you can answer this question, regardless of what you�re
analyzing, you�ll be one step ahead of everyone else. The key word
here is: Limitations.
Why does history repeat itself when accessing a
baseball player�s ability? Yep you guessed it: Limitations!
There are limitations in a ball player�s ability and they come in
two forms: physical and mental. Alex Sanchez is never going to hit
50 homeruns in a MLB season, even if he IV�s a direct line of
horse growth hormones for 3 years (and apparently he tried some
form of steroids). It�s just not within his
physical structure. Sanchez has a certain range of offensive abilities
that are quantifiable and forecast-able within a certain degree of
accuracy. On the other end of this spectrum is a player like Craig
Biggio who for years was able to synergize his mental & physical
attributes enabling himself among the fantasy elite.
Unfortunately, players similar to Biggio's body type are also the type for fade off
fast as their body's age. While a player like Mike Sweeney can
still mash a ball 500 feet with a wretched back, a player
like Biggio needs 100% of his health.
We know,
again within a certain degree of accuracy, that batters do not hit
a peak until their 28th birthday, some sooner, some
later, but within a bell shaped range we know what to reasonably
expect given the limitations of each player...barring an infusion
of steroids of course....BTW: Look for overall offensive numbers
to continue to decline thanks to the new testing in place.
Coming out of
the minors we know that there will be a discrepancy in a
player�s first year stats, verses his minor league stats.
However, based on his past performances we can reasonably access
who has and doesn�t have the potential to post a decent WHIP or
strikeout total. It�s not exact, but it�s reasonable and it
relies on history repeating itself.
As important
as it is to follow history in an up trending pattern during a
player�s career and conversely down trending during their latter
seasons, it�s also important to throw out the anomaly seasons.
This is just part of what our player projections algorithm is
programmed to do.
Armed with a
collection of Baseball data since 1880 (125 years), we use a hybrid non-linear
regression formula to backward integrate the data. From there we basically
use our statistics program (MatLab) to find the most important
variables that have any statistical relevance from year to year.
Using the end result of variables (moving trend analysis being the
most weighed) we are able to produce results that are within
acceptable ranges in predicting a player�s forward season.
From that
point we scrutinize each player's computed projection and make what
I call �subjective injections�.
Factors such as playing time are always subjective, as are
human elements such as incentive, which obviously can not be
factored by a machine, thus we intercede subjective analysis on
at least 25% of the players (100% related to playing time
expectations).
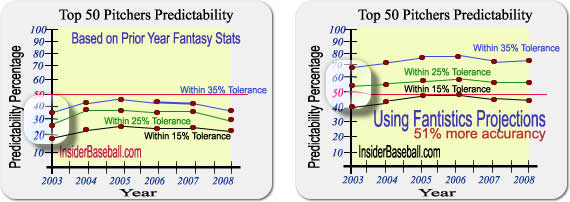
Below is a
series of charts showing how we stack up against the notion that
projecting Baseball statistics is guess work. It is certainly not,
especially when handled correctly by a statistician. Here's a
graphical look comparing how we've done since our inception in
1999:
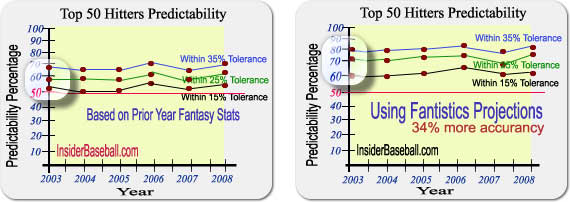
The Chart above (to the
right) depicts the reliability of using previous year's statistics to
predict future year statistics for the top 50 batters. As you can see
history is a good indicator, however the mean is within 50-70% within
the 15-35% tolerance levels. The Chart to the right (above) shows the
value that Fantistics adds to the predictability of baseball
statistics, our 7 year mean lies between 65-90% accuracy between the
tolerances, an incremental gain of exceeding 40% on average. Although pitchers are historically a
very difficult group to predict or prognosticate. Fantistics
has been remarkably accurate in predicting the trend for
starting and relief pitchers over the last 6 seasons.
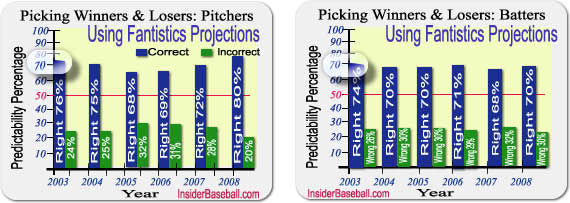
Fantistics
has been remarkably accurate in predicting the direction (up
trending or down trending) on 70-82% of position players, and
65 to 76% of Pitchers since our inception (see below)
As a side note,
reliable forecasting would be extremely difficult if it were not for
the large number of games played during a baseball season. A full
season of 162 games provides us with a whole lot of information to
make a reliable forecast based on the supple sample size.
Player
Projected Stats are developed from the "Bottom -Up"
 It is also very important to understand that the Projected Players Values
and stats are going to add up to more than the possible year end results.
Projecting MLB player stats or fantasy values based on the aggregate results
and working them down to individual performances (the Top-Down approach) is
not justified statistically. We have found through our research that the only legitimate way to forecast individual performances is through a bottom-up
approach, since we are following/forecasting players and not teams or
leagues in the typical fantasy league.
It is also very important to understand that the Projected Players Values
and stats are going to add up to more than the possible year end results.
Projecting MLB player stats or fantasy values based on the aggregate results
and working them down to individual performances (the Top-Down approach) is
not justified statistically. We have found through our research that the only legitimate way to forecast individual performances is through a bottom-up
approach, since we are following/forecasting players and not teams or
leagues in the typical fantasy league.
Forecasting from a
"top-down" approach leads to a serious shortcoming in the prognostication
of lesser known players and/or players whose roles are yet to be defined.
The immediate concerns during the preseason are that roles (playing time)
are not clearly defined among the new and the aging players. With this said
the most dominate reason that our full projected stats and fantasy
values will never add up to the year end aggregate results is because of
Injuries and changes in playing time situations during the season. There is
no way to avoid it, players get hurt, aside from those who have a history of
injuries, there is no way to forecast which currently healthy players are
going to get hurt. Sure we forecast decreased playing time among those
who have shown an inability to stay healthy, but a sizable portion of those
players who land on the DL every year are 1st timers. Thus when we forecast
our projections we have to rely on the known, forecasting from the bottom up
(players verses aggregate totals), if we didn't we'd be forecasting between
75 - 80% of a player's potential stats....and we'd also have to leave off
those players that will split time between the minors and majors this
season.....A definite No-No.
In
closing, I know that many of you have read a multitude of different
theories on projections, but I assure you that our logic is fundamentally
sound and based on empirical evidence. Surely we do not possess a crystal
ball, but having the right foundation is a key component to success on
draft day....Gentlemen start your engines!
-
Anthony A. Perri
With
so many indicators, which one provides us with the most reliable information
at a glance? FPI
Let's start with a
little background for our new members....as many of our readers already
know, we created the Fantistics concept through a mathematical model, in
fact our name is actually a derivative of two
endearing words �FANTasy� & �statISTICS� (if I had a dime
for every time someone called us FantAstics, subscriptions would be
complimentary). The stimulus for the
research came from my experience in solving human behavioral scenarios through mathematical
means. Using regression analysis we were able to define the variables that
fit a pattern of relevancy, thus was born the Fantistics Projections Model.
A model that has a perfect record through 9 total seasons (the last 5
published) and through 56 years of back testing. Perfect because it has never failed
to provide us with less than 70% accuracy in correctly
forecasting the direction of player values (up or down) the following
season, excluding injuries.
One of the leading
indicators or variables that we use to compute our projections is an index
that we created called the Fantasy
Production Indicator (FPI) or fantasy points per plate appearance. Since it adds walks into the denominator,
it should really be called fantasy points per plate appearance. What makes
this indicator �Beautiful� is that it has a higher correlation to
fantasy values than some of the more common indicators (see chart below).
However this isn�t rocket
science.....rather it considers some of the most available statistics to
produce a numeric value which is highly correlated to fantasy production.
In his best seller, MoneyBall, Michael Lewis describes
the importance of the Walk as explained by guru GM Billy Bean. Similarly
we've been touting the importance of the Walk in Fantasy Baseball since
1999, as Walks lead to many other relevant fantasy categories such as runs,
stolen bases, and ultimately every other offensive player category (as
opposing pitchers start making better pitches to those players who have a
keen eye).
Fantasy
Production Indicator
(FPI) gives
us the player's quality per plate appearance. Stat Categories within this
indicator include and are valued accordingly:
|
Batters
|
AB
-.5
|
H
+3
|
2B
+4
|
3B
+5
|
HR
+6
|
BB
+1.5
|
SB
+2
|
CS
-1
|
|
These
categories are then divided by the players at bats & walks (PA)
|
Important Roto
categories such as RBI�s & Runs scored are not included in this
calculation because of their dependence on outside influences (teammates
getting on base, and teammates driving them in).
Comparison:
Finding the Best Fantasy Value Indictor
|
Player
|
|
|
EYE
|
OPS
|
FPI
|
|
Rank
|
K/PA
|
BB/PA
|
BB/K
|
OB+SLG
|
FP/AB
|
|
Top 10%
|
$14.3
|
$25.1
|
$24.5
|
$31.9
|
$32.2
|
|
Top 20%
|
$14.3
|
$21.1
|
$18.4
|
$29.5
|
$30.9
|
|
20%- 40%
|
$14.7
|
$16.4
|
$15.7
|
$19.1
|
$17.1
|
|
40%- 60%
|
$13.0
|
$12.7
|
$13.4
|
$12.4
|
$13.1
|
|
60%- 80%
|
$13.1
|
$9.6
|
$11.6
|
$6.2
|
$6.8
|
|
80%-100%
|
$12.0
|
$7.5
|
$9.6
|
$3.7
|
$3.3
|
The
analysis in the chart above considers all batters who had a minimum of 400 at bats
during the season. This analysis chart provides the results of the 5 leading
indicators of fantasy value (assumes a typical 5x5 league) . The higher the
values in the upper ranges (Top 10%, Top 20%, 20-40%) the more direct
correlation that the indictor has to fantasy value.
Below is a synopsis
of the leading indicators used within the baseball community in comparison
to our indicator Fantasy Production Indicator (FPI):
#5.
Strike-out per plate appearance (K/PA):
Strikeouts per plate appearance are a sign of a hitters� ability to
make contact. Although the chart above shows that there is very little
correlation between the ratio and fantasy value (The top 10% of hitters who
had a low K/PA only produced on average $14 in Fantasy Value), it does play
an important role in accessing the
ability of young hitters when combined with other stats or when determining
an individual trend. However it has very little if any relevance to
fantasy success.
|
Regression Statistics |
Refresher on the Use of
Regression Analysis |
|
Multiple R |
0.0558598 |
R Squared tells us how well the estimated equation |
|
R Square (LOW) |
0.0031203 |
fits the data, or the "goodness of the fit". |
|
Adjusted R Square |
-0.0009156 |
As a rule of thumb, the higher the R Squared,
the |
|
Standard Error |
0.0549236 |
more confidence you have in the correlation between |
|
Observations |
249 |
the two variables (in this case the indicator and the |
|
|
|
Fantasy Value). |
#4. Walk per
plate appearance (BB/PA):
Walks per plate appearance is an often ignored stat, and probably one
of the most underrated statistics in Baseball. MLB Hitters
that are frequent "walkers" are often disciplined hitters who wait for
strike-zone pitches or pitches that are hittable. However taking Walks
is not enough of a factor on it's own to produce a strong correlation with
fantasy value.
|
Regression Statistics |
|
Multiple R |
0.2466601 |
|
R Square (LOW) |
0.0608412 |
|
Adjusted R Square |
0.0570389 |
|
Standard Error |
0.0336639 |
|
Observations |
249 |
#3. EYE:
Walks/Strikeouts (BB/K): The term �eye� or �batting eye� was
developed by sabermetricians years before my entry into the sports
forecasting industry, and has served as a very important forecasting tool.
However according to our analysis it�s usefulness is marginally better
than the BB/PA (Walks per plate appearance). In fact our 2003 data shows
that it actually fared a little worse, and the R Squared regression below
confirms our findings.
|
Regression Statistics |
|
Multiple R |
0.2233144 |
|
R Square (LOW) |
0.0498693 |
|
Adjusted R Square |
0.0460226 |
|
Standard Error |
0.3164427 |
|
Observations |
249 |
#2. OPS: On
Base Percentage + Slugging Percentage (OPS): One of the most telling
indicators of fantasy excellence. However it will distort some
players, such as Barry Bonds who's 2003 OPS produced a 16% gap between
himself and the next highest OPS players, Sammy Sosa and Jason Giambi. The
problem was that their fantasy values were much closer than the stat
indicates.
|
Regression Statistics |
|
Multiple R |
0.6846581 |
|
R Square (High) |
0.4687568 |
|
Adjusted R Square |
0.466606 |
|
Standard Error |
0.0679085 |
|
Observations |
249 |
#1. FPI:
Fantasy Production Indicator (FP/AB): This is the Fantistics Value
Indicator, which has the best correlation to fantasy values according to our
analysis. Again, it's not rocket science since it should produce a strong
correlation to fantasy values since many of the same components are included
in the calculation. This indicator is a very important one because it not
influenced by events such as injuries & managerial decisions that affect
player playing time. Which assists us in expanding on a player�s partial
season stats and potential.
|
Regression Statistics |
|
Multiple R |
0.7014556 |
|
R Square (Highest) |
0.4920399 |
|
Adjusted R Square |
0.4899834 |
|
Standard Error |
0.0750323 |
|
Observations |
249 |
Using FPI,
we can assign labels to certain types of players:
|
FPI
(FP/AB)
|
Equivalent
|
Player
Example
|
|
>
.90+
|
Fantasy
God
|
Albert Pujols |
|
0.84-0.90
|
Super
Star
|
Manny
Ramirez
|
|
0.76-0.83
|
Fantasy
Star
|
Carlos
Delgado
|
|
0.65-0.75
|
Above
Average
|
Preston Wilson
|
|
0.55-0.64
|
Average
|
Ryan Klesko
|
|
0.45-0.54
|
Slightly
below Average
|
Scott Hatteberg
|
|
0.36-0.44
|
Below
Average
|
Eric
Karros
|
|
<
0.35
|
Fantasy
Irrelevant
|
Alex
Cora
|
Veteran
players do not deviate greatly from their historical FPI's, infact they
usually fall between 5-10% of their base FPI every season. It's the
young up and coming players that frequently trend upward and provide
us with the most value on draft day.
The
Fantistics Draft
Strategy VAM

Article from previous seasons, but explains the VAM concept
VAM..Value Above Mean-
It's difficult to say that any one
concept is fully encompassing, but when it comes to Fantasy Drafting, the
Fantistics' theory of Value Above Mean (VAM), is
the definitive concept
to winning on draft day.
VAM: Value Above Mean (or
average) is a computation which first measures a player's fantasy
"worth" within his position and then secondly compares that "worth" to other
players at different positions. VAM is also popularly known as the
Value Based Drafting Method or the Position Scarcity theory. By taking the average fantasy
worth
for the typical number of starters at each position (based on your
league specifics) we form a "baseline" which we can use to relatively compare
each of the players at the particular position by. In a perfect world, we
compared this strategy against "simulation owners" who were set to draft
according to total fantasy points or $ valuations, and found VAM to be a
considerably more effective tool. VAM is
most effective in the early rounds of a draft (as evidenced by the graph below)
In 1998, we developed
the concept using a statistical software package (MATLAB),
and since then we have run over 100,000 simulations. 2012 will be our
14th year in which we have recommended this strategy to our
subscribers.
The reason why VAM
is effective is due to a theory called "positional value",
or "position scarcity".
The positional value system works because it values players in
relation to their positional peers. In recent seasons, some
fantasy folks have incorporated the position scarcity concept in
their bidding or valuations without the numerical algorithm that we
have quantified. Who can forget John Hunt's 2000 Baseball Weekly
article on the "$50 Pedro Martinez bid", it was a brilliant
move and opened some eyes to the true valuation of quality players at
weak positions. A then healthy Pedro was so dominating in many
major Rotisserie categories and essentially dwarfed the average pitcher
available from the AL. Would Martinez have held as much clout if
the average draft-able pitcher was the equivalent of a "Joe
Mays"? Ask
yourself this question: What is the drop-off from the best to the
worst player that will be selected at each position in your draft? If
your going from "Johan Santana" to "Eric Milton" at the
pitchers position, and from "Todd Helton" to "Sean Casey" at
the 1st base position...I'd take my chances with
drafting the bottom of the barrel 1st Baseman than the rear in the
pitching department. Couple this with the fact that bargains exist late
in the draft, and you understand the importance of drafting quality
players at notoriously weak positions. Hence this is
the fundamental theory behind the VAM (Value Above Mean) concept. You
want to elevate the value the top performers which come from the
weakest positions, according to your draft parameters. This is the
principal behind our draft software. Our algorithm will produce a
value (a rank per se) for each player based on your league criteria.
It's really relative to your league parameters, as an example, if your league
requires a
high number of outfielders, it's quite possible
that outfielders will be in demand, creating a righteous artificial
increase in their absolute value.
More
on the VAM Concept
Depending on your
league setup, subscribers who use our projections model database,
will see the scarcity of quality at these positions
(Catchers, Shortstops, Third Baseman, & Pitchers). If you're in a
league that sets rosters according to position (and most are),
then you have to value the incremental gain by stars (like Ivan
Rodriguez C, Alex Rodriguez 3B, Miguel Tejada SS, & Johan
Santana P) at
a higher premium, since the average player at these positions are
worth much less in general than a typical player (in fantasy
terms), and some of these players are substantially better than the
others at their position. For instance the average catchers'
production is approximately 35% less (assuming 200 drafted
batters) than that of the average fantasy batter. In simple
terms why pay $20 for Johnny Damon (OF) when you can purchase Ivan
Rodriguez for $20. Their fantasy statistics will be comparably
balanced, but Rodriguez will outperform the typical catcher by 50%,
while Damon will only outperform the typical outfielder by 10%.
Thus you capture that incremental gain of 40% (in a perfect
world)�doing this over and over again you can see how the odds
stack up in your favor (Of course we don't live in a perfect
world, thus these gains should not be calculated on a 1 to 1
basis, as you'll read ahead in our Positional Probability
paragraph).
After the top 80-90 players are
selected, you
should start considering your positional and specific category needs. As you can see from
the chart above, the incremental gain starts to diminish rapidly at this point.
The software will guide you through the favorable VAM players based on
your league parameters and
then its time to "switch off" and consider the straight dollar values/
or rank as the players remaining to be drafted do not show a
significant difference in projected valuation.
Positional Probability
Based on our most
recent research, we have refined the VAM model to account for the
forecasting probability of every position. Since every sound
forecasting model begins with the most recent statistical information
as it's base, we performed extensive research on the predictability of
using prior year stats as a barometer for future performance.
Based on our FPI (Fantasy Performance Indicator) calculation, the
following chart highlights the 3 year predictability of
each position:
|
3 YR Average Predictability
|
|
(based soley on Prior Year Stats) |
| |
Following Season Performance within |
|
Position |
15% |
25% |
35% |
|
C |
32% |
43% |
53% |
|
1B |
62% |
75% |
87% |
|
2B |
33% |
52% |
65% |
|
SS |
40% |
55% |
68% |
|
3B |
38% |
53% |
67% |
|
OF |
49% |
63% |
75% |
|
Starting P |
30% |
41% |
47% |
|
Relief P |
37% |
48% |
55% |
As you can see, based
solely on prior year stats, Catchers and Pitchers offer remarkably
poor predictability. Even at 35% of last year's performance only 53%
of catchers and 47% of Starting Pitchers are able to attain mediocre
results. While over 87% of 1st basemen reached their mark within the
35% range.
The reason for these
results are numerous, but they revolve around logical explanations.
Consider that the catching position is one of the most physically
abusive positions on the diamond and the unnatural motion of throwing
a baseball (pitchers) can take it's toll, making players from
these positions a calculated risk. On the flip side, 1st basemen are
historically the least likely position players to get injured. Likely due to
the relative non physical nature of their playing position.
The bottom line is that
these variabilities should be captured in any position scarcity
model...and they are captured in ours. It's a big reason why a catcher
like Ivan Rodriguez is not the #1 player recommended to be drafted.....he
likely would be based solely on a position scarcity model due to the
lack of production from the position in general.
The Bottom
Line: VAM works
Although VAM would
work perfectly if we lived in a vacuum and our projected
valuations turned out to be 100%
prophetic...of course we don't and they're not going to be.....However
through the power of mathematical probability, the odds are in
your favor
using the VAM strategy.
It does however
take more to winning a championship than just drafting an optimal
set of players, you will still need to stay on top of
the game during the season and make good management decisions (we'll help you here as
well).
The VAM
strategy is incorporated in our Draft Advisor module contained within the
projections software.
Our player rankings/valuations adjust as players are selected,
adhering to the changing dynamics of your draft (changing scarcity value
within the player positions). After a player is selected/drafted, the
software will display/suggest the best players remaining....which should
guide you to a successful outcome.
Good Luck on Draft Day, we
hope to see you throughout the season !
|